The effects of climate change are becoming increasingly severe, with progressively profound impacts on the natural environment, our societies, our business activities, and our everyday lives.
Against this backdrop, there is a growing swell of action across the globe with a collective mission to lower the temperature rise by decarbonising our planet. In 2015, at COP21, 196 parties adopted the landmark Paris Agreement, the goal of which is to limit global warming to well below 2 degrees Celsius, and preferably 1.5 degrees Celsius, by the end of the century. To achieve this ambitious temperature goal, a significant transformation of the current energy supply-demand structure is needed, and governments, institutions and corporations now need to invest heavily in climate change adaptation activities if we are to carve a path to a carbon neutral world by mid-century.
The Paris Agreement has heightened expectations not only for countries and governments to fulfill key roles in mitigating climate change, but also for the private sector. Companies are expected to implement measures to achieve a decarbonised society through their business activities, and there are growing calls for companies to disclose climate change-related information in line with initiatives such as the Task Force on Climate-related Financial Disclosures (TCFD)*1The Task Force on Climate-related Financial Disclosures (TCFD) set up by the Financial Stability Board. In June 2017, the TCFD announced its recommendations on climate-related financial disclosures in order for investors to be able to make appropriate investment decisions. MC has decrared support for the TCFD and its recommendations in 2018. And the General Manager of MC’s Sustainability Department served as a TCFD member from 2018 to 2021 and as a planning committee member of the TCFD consortium thereafter. MC is supporting the TCFD’s activities and helping its recommendations to take root throughout the business community.*1, and the disclosure framework being developed by the International Sustainability Standards Board (ISSB)*2The International Sustainability Standards Board (ISSB) set up by the IFRS Foundation Trustees. ISSB is an independent, private-sector body that develops and approves IFRS Sustainability Disclosure Standards.*2 of the IFRS. As a result, opportunities for dialogue on climate change between companies and investors are expanding - including through the institutional investor initiative, Climate Action 100+, and the TCFD Consortium (launched in Japan in 2019). The purpose of these initiatives is to encourage the disclosure of information to allow investors and other stakeholders to properly monitor and evaluate the climate-related risks and opportunities of companies.
Since its inception in the 1950s, Mitsubishi Corporation (MC) has held the”Three Corporate Principles ”as its core philosophy. These guiding principles inspire us to conduct fair and sound business activities at all times. MC adopted the Environmental Charter and Social Charter in accordance with the Three Corporate Principles, and we commit to increase our corporate value as well as to contribute to the sustainable development of society through the simultaneous generation of economic, social, and environmental value, as a globally integrated business enterprise.
At MC, we believe that while climate change poses significant business risks, it also presents us with new business opportunities for innovation, disruption and growth. Accordingly, MC has set “Contributing to Decarbonized Societies” as one of its material issues as we strive to achieve sustainable growth.
In shifting to a decarbonized society, it is necessary to formulate specific policies that take into account the actual conditions (energy and power mix, geographical conditions and constraints, stage of economic development, population, etc.) that differ from country to country and region to region, and to steadily implement them one by one. Through our global network of offices, subsidiaries and around 1,700 group companies, we work with a wide range of stakeholders around the world each day in developing our business.
In our Midterm Corporate Strategy 2024 MC outlines our approach to the continuous creation of significant shared value by elevating the MC Group’s collective capabilities in order to address societal challenges, while at the same time delivering on ambitious targets for growth.
MC views sustainability and climate initiatives as vehicles through which to create societal and environmental value through all of our businesses, and we believe in the importance of demonstrating how they contribute to the broader growth strategy of our business.
Figure 1 Outline of Midterm Corporate Strategy 2024

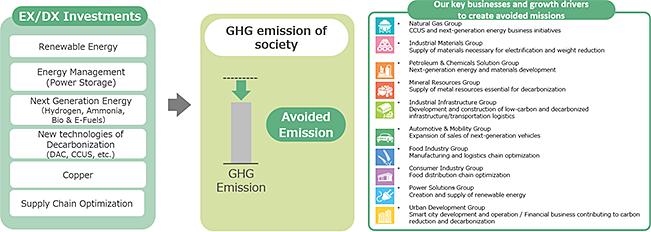
Our Energy Transformation (EX) Strategy, one of the growth strategies set forth in Midterm Corporate Strategy 2024, demonstrates how we will contribute to the realization of a decarbonized society through our business activities. Since EX-related businesses take time to develop, it is important to take the initiative by looking five to ten years into the future. Therefore, by accelerating and focusing our efforts on EX-related investments, we will strategically reinforce our business portfolio to ensure that it is future-fit for a carbon neutral society. To this end, we will make EX-related investments of 1.2 trillion yen over the three-year period of Midterm Corporate Strategy 2024 as well as expanding the ratio of our EX-related business portfolio from 30% to around 40% (end of FY2021~2024) on the path to 50% in the future. Specifically, as an EX service, we aim to promote the decarbonization of the entire energy sector by connecting seeds (solutions) with needs related to EX Resources, Materials and Products and by becoming a decarbonization solutions provider by working closely with industry, consumers and regions to address emission reduction needs.
We have decided to newly disclose the effect of greenhouse gas reduction generated through MC Shared Value as our avoided emissions. This will be utilized as a quantitative indicator to measure the degree of contribution our company is making to GHG emissions reductions as well as the extent to which we are able to capture business opportunities in the transition to a decarbonized society.
Figure 2 EX Strategy from Midterm Corporate Strategy 2024

Avoided emissions are a quantitative indicator of the progress toward our EX strategy of transitioning to a decarbonized society through our business. They indicate the degree of contribution our company is making to GHG emissions reductions as well as the extent to which we are able to capture business opportunities in the transition to a decarbonized society. While continuing to foster relationships with our partners, customers and other stakeholders, based on our goal of addressing societal challenges and creating MCSV through our business, we will continue to vigorously promote our EX strategy, co-create businesses that generate avoided emissions, and contribute to the realization of a carbon-neutral society.
Please refer to the section below for specific examples.
* As of March 31, 2024
MC recognizes the necessity for close collaboration and co-creation with various stakeholders in order to effectively respond to climate change and achieve a decarbonized society. To that end, we will actively engage wide range of stakeholders – including partner companies, governments, local municipalities, investors, NGOs, and industry associations – to create MC Shared Value by elevating and driving the transition to a carbon neutral society and creating new industries to address challenges facing society and industry on the themes of (1) utilizing renewable energy and other local energy resources, (2) creating new “Carbon Neutral (CN)” industries, and (3) developing vibrant communities by helping to resolve regional issues. Below are some specific examples of how we engage with and build partnerships with external stakeholders.
When it comes to addressing some of the key challenges we face in carving a path to a carbon neutral society and decarbonising our portfolio, MC collaborates with a variety of partner companies that share this ambition. The specific areas of collaboration can be divided into the below six categories.
For an in depth exploration of these initiatives please view the relevant content here.
MC supports and advocates for global and local initiatives that contribute to the realization of a decarbonized society such as the expansion of renewable energy, the development and societal implementation of next-generation technologies such as CCUS and hydrogen, and increased climate-related and other ESG disclosures. MC participates in seminars and training sessions hosted by the Japanese Ministry of Economy, Trade and Industry and Ministry of the Environment, and holds individual discussions on themes such as the expanded utilisation of TCFD guidelines and proliferation of renewable energy.
In particular, as a planning committee member of the TCFD consortium, MC actively participates in activities to support Japanese companies’ response to climate change. Furthermore, we are participating as a key member in discussions on the establishment of various regulatory frameworks in the Public-Private Fuel Ammonia Promotion Council*3Established in October 2020 for the purpose of sharing technical and economic issues for introducing and increasing the use of ammonia for fuel applications and a timeline for solving these issues among the public and private sectors, and to promote concerted efforts to address these issues.*3 and the Public-Private Council for Promoting the Introduction of SAF*4Established in April 2022 to promote the development and manufacture of internationally competitive and domestically produced SAF, as well as to discuss technical and economic issues and solutions for future supply chain development among the public and private sectors, and to promote concerted efforts to address these issues.*4, both led by the Japanese Ministry of Economy, Trade and Industry.
Through direct discussions with investors and NGOs, we have received valuable insight and opinions regarding expectations in relation to our strategies toward the transition to a decarbonized society and our policies for individual businesses, and reflect these in our considerations for business policies and measures. In FY2023, we held approximately 40 discussions with investors on sustainability, and 82(Japan:5, Europe:29, Americas:48) discussions with NGOs.
MC promotes initiatives that contribute to the transition to a decarbonized society through active participation in climate change working groups. When joining or remaining a member of an industry group, we confirm that their climate change initiatives are in line with MC's basic policies. Through active participation in working groups and opinion exchanges related to climate change, mainly with the Japan Business Federation (Keidanren), the Japan Foreign Trade Council, and the World Business Council for Sustainable Development (WBCSD), each of which MC is a member, we are promoting activities aimed at the transition to a decarbonized society.
COLUMN
Participation in the Carbon Recycling Fund Institute
The Carbon Recycling Fund Institute was established in August 2019 with the aim of both addressing issues around global warming and improving global energy access through innovations in carbon recycling. MC has been a member since November 2019. Through access to the latest information on carbon capture, utilization and storage (CCUS) and enhanced networking with member companies, we aim to pursue business opportunities and contribute to solving climate change issues.
MC recognizes climate change as one of its key management issues. . Since initiating discussions on the resilience of our business to climate change in 2016, we have established and are expanding internal mechanisms to integrate climate change and other ESG factors into the decision-making process for business strategy and operations across the MC Group.
Figure 3 Main initiatives to date

MC’s approach to, and policies on, climate change are formulated and regularly reviewed by its Executive Committee, MC’s officer-level decision-making body. Furthermore, as stipulated in the regulations governing MC's board of directors, the Executive Committee reports its findings regularly (approximately three times a year) to the Board of Directors.
Board of Directors and Executive Committee Deliberations and Reports
| Basic Policy on Climate Chang | Covers climate-related initiatives through MC’s businesses, adoption of the TCFD recommendations, details on climate-related financial disclosures, etc. |
|---|---|
| Important Matters | Assessments of climate-change risks and business opportunities (including scenario analyses), GHG reduction targets and status of reduction initiatives, etc. |
Prior to the Executive Committee addressing the above Basic Policy and Important Matters, we receive advice and recommendations from the external experts on our Sustainability Advisory Committee, and hold thorough deliberations at the Sustainability Committee (a subcommittee of the Executive Committee) which consists of all Business Group CEOs. Additionally, Group Chief Sustainability Officers and Group Sustainability Managers are appointed within each Group. These individuals are responsible for developing a salient management strategy, overseeing sustainability-related initiatives including climate action, and strengthening climate-related initiatives and insight for their respective businesses and strategies. The above Basic Policy and Important Matters are therefore comprehensively addressed when making key decisions on business strategy, as well as when screening new investment and loan proposals.
Climate-Change Governance Structure
| Board of Directors | Supervises MC’s climate-related actions and initiatives | Convenes approx. three times year |
|---|---|---|
| Executive Committee | Makes decisions regarding MC’s basic policy on climate change Makes decisions regarding important matters pertaining to climate change |
Convenes approx. twice a year |
| Sustainability Committee (reports directly to Executive Committee) | Deliberates on MC’s basic policy on climate change and important matters therein, and reports findings to Executive Committee | Convenes approx. twice a year |
| Sustainability Advisory Committee | Offers advice and recommendations regarding MC’s basic policy on climate change and important matters therein | Convenes approx. twice per year |
| Officer in Charge | Kenji Kobayashi (Senior Vice President, Corporate Functional Officer, CSEO) | |
| Department in Charge | Sustainability Department | |
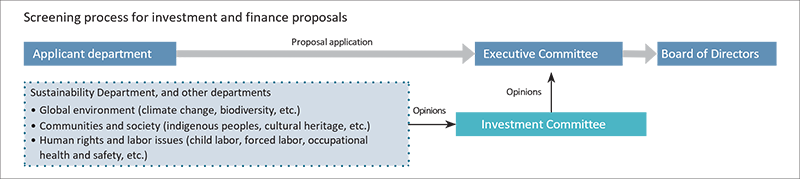
MC ensures that all loan and investment proposals submitted for review by the Board of Directors and the Executive Committee are first deliberated by the Investment Committee, a subcommittee of the Executive Committee.By including the General Manager of the Sustainability Department in Investment Committee meetings (as a committee member), MC guarantees that the screening and decision-making process comprehensively considers environmental and social impacts. Besides screening new proposals, the Investment Committee also strives to implement improvements for existing business investees, by monitoring their management practices for continued improvements and value enhancement. From the perspective of climate change-related transition risks/opportunities and physical risks, the review of proposals and decision-making processes considers quantitative data such as GHG emissions, as well as national policies and industry trends. Since August 2022, when screening new investment proposals for “Transform” and “Green” businesses, which we identify as having significant climate change transition risks and opportunities, in accordance with the “MC Climate Taxonomy”we have been conducting profitability assessments based on indicators (such as internal carbon pricing) that use key assumptions under decarbonization scenarios.
In October 2021, MC formulated its Roadmap to a Carbon Neutral Society in which we declared our goal of acheiving net zero GHG emissions by 2050. As an active player in a variety of industries including resources and energy, we have formulated a number of goals and action plans in order to fulfill our responsibility to provide a stable supply of energy while striving to achieve a carbon neutral society.
Roadmap: Three Core Points
In May 2022, MC established and disclosed Midterm Corporate Strategy 2024, which is based on the company-wide business promotion theme of “integrated energy transformation (EX) and digital transformation (DX) initiatives to create a new future” as set forth in the Roadmap.We have pledged to strive to continuously create significant MC Shared Value by strengthening the collective capabilities of the MC Group and addressing societal challenges through our business, and looking toward the realization of a decarbonized society, we will lead EX initiatives to achieve our growth strategy. (”Creating MC Shared Value”)
In order to achieve the GHG reduction targets (halve by FY2030 (FY2020 baseline), net zero by 2050) outlined in “The Roadmap to a Carbon Neutral Society”, as sustainability policies to address climate change, we have introduced mechanisms for simultaneously decarbonizing and reinforcing our portfolio as shown in figure 4.
Figure 4: Mechanism for simultaneously decarbonizing and reinforcing our portfolio.

The basis for this mechanism is our “MC Climate Taxonomy”, a new business classification system implemented in FY2022. MC Climate Taxonomy, which covers all of our approximately 130 business units, classifies each into 3 categories: Green (businesses with significant climate-related transition opportunities), Transform (businesses with significant climate-related transition risks), White (Other). For businesses classified as Green or Transform, appropriate governance and risk management systems have been adopted to carry out evaluations using assumptions under decarbonization scenarios when screening individual investment proposals, confirm GHG reduction plans when formulating investment plans, and confirm that our business is aligned with a 2050 net zero scenario in terms of both individual projects and company-wide business strategy.
The concrete classification process is shown in Figure 5. In selecting “Transform” businesses, both the volume of GHG emissions (Scopes 1, 2 and 3) and the barriers that exist in reducing GHG emissions are considered. In order to determine the specific reduction barriers, we use Scope 3 category 11 (GHG emissions associated with the use of products sold) and Scope 1 6.5 Gases(emissions that cannot be avoided when doing business), both in which emissions reduction are difficult to acheieve, as indicators from the perspective of avoiding stranded assets.
We started disclosing Scope 3 Category 11 emissions in February 2023. The background behind the disclosure of these emissions and results can be found here.
Figure 5: MC Climate Taxonomy Approach

The mechanism for simultaneously decarbonizing and reinforcing of our portfolio, including the MC Climate Taxonomy, is effectively managed via the 5 steps outlined in Figure 6.
Figure 6: Mechanism of initiatives based on “Midterm Corporate Strategy 2024 - Creating MC Shared Value”

Climate scenarios explore different potential states of the world in which different temperature trajectories are achieved based on a series of consistent outcomes and assumptions relating to socioeconomic developments, policies, markets, and technologies. Scenarios are created and published by independent agencies, such as the International Energy Agency (IEA), the Intergovernmental Panel on Climate Change (IPCC), and the Network for Greening Financial Services (NGFS) - along with companies that seek to verify and evaluate potential climate risks and opportunities for their own businesses via the creation of their own scenarios.
In order to both decarbonize and reinforce our portfolio, we believe it is essential to conduct scenario analyses by referring to these climate scenarios, thereby allowing us to properly understand the transition risks and opportunities for each of our businesses and to take these into account in formulating business strategies. To this end, since FY2019, we have been conducting scenario analyses in line with the TCFD recommendations, using primarily IEA climate scenarios, and since FY2021, we began conducting scenario analyses using a 1.5°C scenario predicated on net zero by 2050.
We used the IEA Net Zero Emissions by 2050 Scenario (IEA NZE) as a reference for our 1.5°C scenario analysis in FY2021. However, the IEA NZE data lacks the granularity required to extract precise insights that reflect MC’s particular business characteristics and strategies. As such, MC collaborated with a third-party organisation to create and utilise a customised, specific model of the 1.5°C scenario (FY 2022 1.5°C Scenario), while aligning key assumptions with the IEA NZE wherever possible, thus allowing for a detailed level of granularity on topics like demand by region and product. Key assumptions for the FY2022 1.5°C scenario and the comparison with the IEA NZE are shown in Table 1 below.
Table 1 Key assumptions for the FY2022 1.5°C scenario and the comparison with the IEA NZE

Our FY2022 1.5°C scenario assumes both decarbonisation and economic growth similar to the IEA NZE, with an expected average annual growth rate of approximately 3% in GDP by 2050, and an expected population of about 9.7 billion in 2050.(See Table 1, ① and ②)
Global CO2 emissions are anticipated to decline by approximately 35% in 2030 compared to 2020 in this scenario, with the expectation that we reach net zero emissions in 2050, largely resulting from changes in land use (e.g., afforestation) and the implementation of negative emission technologies. The IEA NZE, published in May 2021, utilised 2019 as a reference year and projected a linear decrease in emissions toward 2050. Our FY2022 1.5°C scenario, however, reflects GHG emissions data through FY2021. As a result, GHG emission from 2019 to 2021 are marginally less than IEA NZE, though still in the acceptable range of reduction required to realise a temperature increase of less than 1.5°C, as presented by IPCC. (See Table 1 ③, Chart 1)
Chart 1 1.5°C-consistent pathways and GHG emissions presented by IPCC

Under our FY2022 1.5°C scenario, final energy use in 2050 will be approx. 400 EJ. Furthermore, the electricity share in final energy use will reach approx. 50% in 2050 due to enhanced electrification from decarbonization efforts, leading to an expected global electricity demand of approx. 90 billion GWh/year (3 times or more compared to 2020 levels) (see Tables 1 ④ & ⑤). Regarding Table 1 ④ "Final Energy Use", which is considered to differ significantly compared to the IEA NZE, the IEA NZE assumes an average annual improvement in energy efficiency of about 4% and 2.7% from 2020 to 2030 and from 2030 to 2050, respectively, with 2019 as the base year. However, considering that energy efficiency improvements over the past decade have averaged less than 2% per year, the 1.5°C scenario used in FY2022 assumes a more conservative figure of approx. 2% improvement in energy efficiency per year on average through 2050. With regard to "Primary Energy from Oil and Gas", primary energy supply is expected to reach approx. 100 EJ in 2050, which is almost equal to the IEA NZE (Table 1 ⑥). We compared items ④ through ⑥ in Table 1 with the 1.5°C scenarios integrated and published by the WBCSD and confirmed that all of the figures fall within the range of these scenarios (Chart 2)
Chart 2 1.5°c scenarios integrated and published by the wbcsd

While a series of validations through scenario analysis is widely recognized as beneficial as described above, the following points in particular should be noted.
As a global integrated business enterprise with a global network of approx. 1,700 group companies, it is not feasible for MC to apply the scenario analysis to all of our businesses. As such, we selected businesses that are expected to be particularly affected by the risks and opportunities posed by climate change for our scenario analysis, according to the following process.
In selecting businesses from a risk perspective, we considered two indicators: GHG emissions and asset size.
First, we selected businesses that we categorised as "Transform" businesses under the “MC Climate Taxonomy” due to their high emission volumes and relative difficulty in reducing emissions. From among those businesses, we then selected those with significant asset sizes, namely natural gas/LNG, metallurgical coal, and power generation (fossil fuels) (these three businesses account for approx. 70% of the balance of investment out of all "Transform" businesses) as targets of the scenario analysis from a risk perspective. Since MC has already adopted a policy to not enter into any new coal-fired power generation businesses and achieve a 100% non-fossil power generation portfolio by 2050, power generation (fossil fuels) businesses were exempted, and thus natural gas/LNG and metallurgical coal were chosen as final target businesses for the FY2022 1.5°C scenario analysis.
From an opportunity perspective, among the "Green" businesses classified under the "MC Climate Taxonomy" as having significant opportunities related to climate change, we selected renewable energy, which is one of our core businesses and for which we have multiple existing projects, as the target business of the FY2022 1.5°C scenario analysis.
In the following sections, we explain the results of our analysis of the business environment in terms of risks and opportunities for the target businesses based on our 1.5°C scenario analysis, as well as our policy and other initiatives in light of these results.
The natural gas and LNG are important business areas for achieving a carbon neutral society and sustainable economic development, since natural gas and LNG play a variety of roles in the transition to a carbon-neutral society. Roles include being a complement to renewable energy intermittency, an energy source for sectors that are difficult to electrify, and being a raw material for next-generation energy sources. Given the importance of natural gas and LNG, MC conducted a detailed analysis based on the FY2022 1.5°C scenario. The following shows the results of MC’s analysis of the impact on our natural gas and LNG businesses under the FY2022 1.5 °C scenario, as well as our business strategy and initiatives.
In formulating MC’s LNG business strategy, it is important to understand the trajectory and scale of LNG demand under the 1.5°C scenario, which assumes that decarbonization progresses. From this viewpoint, MC verified and analyzed (1) The primary energy supply of oil and natural gas, (2) Natural gas demand, and (3) LNG demand based on the FY2022 1.5°C scenario.
(1) The Primary Energy Supply of Oil and Natural Gas
The ratio of oil and natural gas among primary energy supply does not differ significantly between the FY2022 1.5°C scenario and the IEA NZE. Both scenarios project that energy from oil and natural gas will decline to approximately 265-285 exajoules (EJ) in 2030, and to approximately 100 EJ in 2050. This figure falls within the range of other 1.5°C scenarios for 2050, including the IEA NZE published by the WBCSD (see Chart 3)
Chart 3 Primary Energy from Oil & Gas

(2) Natural Gas Demand
There is no significant difference in global demand for natural gas between the FY 2022 1.5°C scenario and the IEA NZE from now to 2050. In each scenario, global demand until 2030 is expected to remain relatively stable, after which it is expected to significantly decline when renewable energy, hydrogen and other next-generation energy become widespread (see Chart 4).
Chart 4 Global demand for natural gas and LNG

(3) LNG Demand
Demand for LNG is expected to increase following the rising demand for primary energy due to economic growth and the shift from oil and coal to natural gas in Asian countries. For those countries, this is especially the case where natural gas procurements through pipelines is impossible or domesctic production declines due to depleting natural gas reserves. Global LNG demand is even expected to increase until 2030 under the FY2022 1.5°C scenario. If decarbonization progresses beyond the commitments made by nations, demand for LNG, as well as natural gas, is expected to fall after 2030. However, the rate of decline in LNG demand is expected to be slower than natural gas, particularly in Asian countries for reasons mentioned above. Between the years 2040 and 2050, Asian countries are expected to account for over 90% of global LNG demand. IEA NZE only publishes data representing volumes traded between regions and not intra-regional trade, thus a calculation of LNG demand by region and a side-by-side comparison is not possible. However, it is reasonable to assume that the trend in Asia’s rising share of global LNG demand is consistent with IEA NZE data.
In consideration of the business environment mentioned above, for natural gas and LNG businesses, MC will monitor and discuss at the management level the current status and trends of climate change transition risks and, more specifically, items that could affect supply and demand (see below) in the “Transform Discussion” introduced in the Midterm Corporate Strategy 2024 as one of the sustainability measures. Such results shall be incorporated into the final business strategy.
Natural gas and LNG are energy sources that will play a key role in the transition period. Under the FY2022 1.5°C scenario used in this analysis, although natural gas and LNG demand is expected to decline overall in the long term, Asia, which is a strategic region for MC’s LNG business, is still expected to maintain a certain level of demand in the long-term.
Taking into account the business environment mentioned above, MC will be focusing on strengthening its LNG business and decarbonizing its LNG value chain in order to achieve a stable supply of energy and resources as well as decarbonizing its social and economic activities. This is in line with the Midterm Corporate Strategy 2024.
For the longer term, MC shall continue to: 1). work on initiatives to progress the decarbonization of its LNG value chain, 2). optimize its LNG portfolio, and 3). scale-up investment in next-generation energy, while closely monitoring the overarching business environment, including the development on technological innovation and climate-related regulations by various governments.
<Strengthening MC’s LNG Business>
The majority of the production volume from MC’s existing LNG business is sold under long-term contracts. However, MC will continue to improve the competitiveness of its existing LNG business by enhancing operational efficiency and cost reductions, while optimizing its portfolio. For new LNG businesses, MC will make investment decisions by also considering investment returns under a 1.5°C scenario, taking into account the risk of it becoming a stranded-asset in the event decarbonization occurs rapidly.
<Decarbonization of MC's LNG Value Chain>
Together with strengthening its LNG business, MC intends to leverage its position and strength as one of the biggest LNG players in Japan to play a key role in transitioning to a decarbonized society, by the promotion of CCUS, and activities in the production and supply of next-generation energy such as blue hydrogen or e-methane (synthetic methane), which will all contribute to the decarbonization of the LNG value chain. MC believes that its experience, knowledge, and networks gained from the natural gas and LNG businesses over the past 50 years can be utilized in specific new business fields mentioned below.
Through Australian subsidiary Mitsubishi Development Pty Ltd., MC conducts exploration, development, production, and sale of mineral resources in collaboration with its partner BHP. The BHP Mitsubishi Alliance (BMA), which we operate as a joint venture with BHP, is one of the world’s largest metallurgical coal operations, with an annual production volume of over 60 million tons and a share of approximately 30% of the global seaborne metallurgical coal market. Steel is an essential industrial material that every country needs in order to achieve economic growth. MC expects to see continued strong demand for steel, as it is a key component of efforts to develop the infrastructure needed to achieve decarbonization. However, the steel industry has yet to implement large-scale, low-carbon steelmaking methods. In addition, it would take many years for any low-carbon steelmaking method that is developed to be adopted worldwide. MC therefore anticipates a transitional period lasting several decades, during which growth in the use of electric furnaces for steelmaking from scrap iron will be accompanied by a shift to hydrogen-based steel production in conjunction with the advent of a hydrogen-based society. In the meantime, blast furnace steelmaking using metallurgical coal is expected to remain the primary steelmaking method in the foreseeable future. Given these circumstances, MC has carried out the following analysis of the outlook for the business environment under the 1.5°C scenario, the transition risks for its metallurgical coal business, and the business policies and initiatives needed to adapt to these changes.
BMA’s main product is high-quality metallurgical coal, which BMA supplies to the global seaborne markets. As part of the analysis of the business environment surrounding BMA under the 1.5°C scenario, MC carried out step-by-step evaluations of (1) demand for steel, (2) crude steel production by iron source, and (3) pig iron production and the maritime trade in metallurgical coal.
(1) Demand for Steel
Steel is an excellent basic material and supports economic growth in every country. It also plays a vital role in the development of infrastructure for achieving decarbonization. Under the FY2022 1.5°C scenario, demand for steel in 2050 is expected to exceed the 2020's level (see chart 5). Furthermore, since achieving net-zero emissions by 2050 will require rapid action to create infrastructure related to decarbonization, consumption for steel can be expected to expand rapidly from the second half of the 2020s. The IEA NZE predicts a similar level of growth in steel production. These forecasts suggest that demand for steel is likely to remain steady over the long term, even if major strides are made toward the realization of a decarbonized society.
Chart 5 Trends in global steel consumption under the 1.5°C scenario (2020=100%)

(2) Crude Steel Production by Iron Source
The steel industry is seen as a sector in which the reduction of GHG emissions poses major challenges. Efforts are being made to reduce carbon emissions, such as by making further improvements to electric furnace technology and developing hydrogen-based steelmaking technologies. Particularly significant is the hydrogen-based direct reduced iron (DRI) method, which is now being trialed primarily in Europe. However, even under the FY2022 1.5°C scenario and the IEA NZE, the commercialization of this technology is unlikely to take place with large scale until the second half of 2030. This is due to the need to solve various challenges, such as the development of hydrogen supply infrastructure, as well as the level of hydrogen price and carbon prices. Because of these, DRI technology is likely to be adopted gradually in the steel sector, starting in regions where the required conditions are in place, such as Europe. The adoption of this new technology is expected to occur at different times in different regions.
The expansion of electric furnace steelmaking is also expected to lead to a gradual decline in blast furnace pig ironmaking from 2030 onwards.The IEA NZE predicts a decline in blast furnace steelmaking, as well as reductions in carbon emissions from the blast furnaces that continue to operate, thanks to efficiency improvements and the adoption of CCUS technology. According to the IEA NZE, hydrogen-based production methods will account for around 30% of steelmaking by 2050, which is roughly in line with the FY 2022 1.5°C scenario(see Chart 6).
Chart 6 Crude steel production by iron source under the FY2022 1.5°C scenario

The demand for high-quality metallurgical coal produced by BMA is expected to decline more slowly than that for low-quality metallurgical coal, due to the relatively low greenhouse gas emissions from the blast furnace steelmaking process. High-quality metallurgical coal is attractive since there is a growing need for low-carbon measures that can be applied during the transition period when the blast furnace steelmaking process continues to be the prevailing method.
(3) Pig Iron Production and the Maritime Trade in Metallurgical Coal
The gradual decline in pig iron production via the blast furnace steelmaking process will be accompanied by changes in the countries that comprise pig iron output. Pig iron production in China, which currently accounts for around 60% of the global total, is expected to decline, while production in emerging economies such as India and Southeast Asia is expected to grow (see Chart 7).Unlike China, India and many Southeast Asian countries are dependent on imported metallurgical coal, and demand from these countries is expected to sustain the global seaborne trade volumes. Almost all of the metallurgical coal produced by BMA is exported to handle in the seaborne market.
Chart 7 Composition of pig iron production by country under the FY2022 1.5°C scenario

As with MC’s natural gas and LNG businesses, conditions and trends relating to the following key aspects of the metallurgical coal business and their impact on business strategies are monitored and discussed at the management level through the “Transform Discussion.” The results of these discussions are considered in MC’s business strategies.
The steel industry is expected to see a long transition period and the need for high-quality metallurgical coal, which is BMA’s main product, will likely increase relative to low-quality metallurgical coal since it contributes to the reduction of emissions in blast furnace steel making process. On the other hand, the supply of metallurgical coal is expected to decrease as a result of the increasing difficulty of new mine's development such as difficulty of obtaining necessary approvals, and therefore fewer investments in new coal mines. BMA will continue to ensure a stable supply of high-quality metallurgical coal.
MC is also actively working to reduce BMA’s GHG emissions by exploring and implementing initiatives in areas such as renewable energy procurement, methane gas processing, and alternatives to diesel fuel. For example, in 2020 BMA signed a contract to source low-emission power, which will cover around half of BMA's overall power demand at its coal mines. This move will enable BMA to cut its Scope 2 emissions by half by the mid-2020's.
MC has also signed a collaborative agreement with its partner BHP, a major steel manufacturer, and a prominent engineering firm regarding the trial use of CCUS technologies in steelmaking. This initiative is part of MC's efforts to reduce GHG emissions throughout the entire steelmaking value chain.
In the mineral resources business, MC will work to promote its EX strategy from the three perspectives of decarbonization, electrification, and the shift to circular economies. In addition to efforts to decarbonize the steelmaking value chain, MC will also strive to expand its involvement in areas that are essential for electrification, such as copper and raw materials for battery, as well as its recycling business.
Renewable energy is one of the core businesses of MC’s EX strategy. Renewable energy has been selected as a business with major transition potential in terms of climate change and several projects have already been developed. The following analysis was conducted under the FY2022 1.5°C scenario.
Electrification in a wide range of industries is essential in order to achieve net-zero emissions by 2050. It is assumed that a large portion of that electricity needed will be provided through renewable energy, mainly solar and wind power. As shown in Chart 8, in the FY2022 1.5°C scenario, the increase in the scale of total electricity generation and the share of renewable energy in that total generation due to the progress of electrification is very significant. This trend is also consistent with the IEA NZE.
Also, in line with the expansion of renewable energy, power generation amount of which varies according to weather conditions and which has a strong aspect as a distributed power source, further business opportunities are expected to increase, such as the expansion of transmission capacity, utilization of storage batteries, and demand response, which will contribute to improving the flexibility of the power supply and demand system.
Chart 8 Global Power Supply, and % of Renewable Power Supply

The introduction of renewable energy and the spread of battery storage, as well as the accompanying trend toward decentralization of the power supply system, will vary according to country and region depending on the status of policies, regulations, and technological innovations, and the timing of their manifestation may differ significantly.
MC “produces” (generates) renewable energy, “integrates” weather-dependent electricity (through a sophisticated balance of supply and demand), and “delivers” this integrated electricity and high added-value services. By strengthening each of these functions of the power value chain, MC aim to expand our renewable energy business in Japan, where offshore wind power is expected to grow, and in Europe, where Eneco’s platform stands, as well as in the Americas, Asia, and other regions.
MC is making progress toward achieving its target to double its renewable energy power generation capacity from 3.3 GW in FY2019 to 6.6 GW by FY2030.
Specific Initiatives and Case Studies Related to Renewable Energy
<Initiatives in Europe for the Promotion of Renewable Energy (Eneco)>
Eneco is operating power generation businesses, power and gas trading businesses, power and gas retail businesses, and district heating businesses focused in the Netherlands, Belgium, and Germany with a core focus on renewable energy. With a solid customer base that is the third largest in the Netherlands, Eneco has approximately 1,800 MW of renewable energy assetss, which include the ones under construction status. In December 2022, MC and Shell plc were successful in the tender for the Hollandse Kust West Site VI offshore wind farm (760 MW capacity), located approximately 50 km off the Northwest coast of the Netherlands. This will be Eneco’s fifth offshore wind project in the Netherlands and seventh in Europe, bringing total capacity of offshore wind in the Netherlands to 2,500 MW. Renewable energy net equity base capacity will expand from 3,430 MW to 3,670 MW.
<Promoting Renewable Energy in the U.S. through Nexamp’s Distributed Solar Power Generation Business>
Through Diamond Generating Corporation, a wholly owned subsidiary power business in the U.S. MC operates Nexamp, Inc., a distributed solar power generation company. Nexamp's community solar business sets up solar power generation systems in local communities, allowing customers that cannot install solar panels to use solar-generated electricity in their homes or offices.
<Promoting Offshore Wind Power Generation Projects in Japan>
The consortium represented by Mitsubishi Corporation Energy Solutions Ltd. (currently Mitsubishi Corporation Offshore Wind Power Ltd.) was appointed by the government on December 24, 2021 as an operator for an offshore wind power generation project in the following promotion zones under the Act on Promoting the Utilization of Sea Areas for the Development of Marine Renewable Energy Power Generation Facilities. The consortium is moving ahead with the development of a seabed-anchored offshore wind power generation business, the first of its kind in Japan, for general sea areas.
<MC Signs Japan’s First Long-term Corporate PPA for Online Retail Giant Amazon>
MC has signed a long-term Corporate Power Purchase Agreement (Corporate PPA), through which it will supply electricity to data centers owned and operated by the Amazon subsidiary Amazon Web Services, Inc. (AWS). Facilitated by MC Retail Energy Co., Ltd., this Corporate PPA represents Amazon’s first use of renewable energy in Japan.Under the agreement’s terms, West Holdings Corporation will build and maintain roughly 450 solar power stations (with a total installed capacity of approximately 22 MW) for Amazon and supply the online retailer with wholesale electricity. MC subsidiaries Mitsubishi Corporation Energy Solutions Ltd. and ElectroRoute will also be involved. The former will manage construction of the solar power facilities and provide tech support, while the latter will forecast the facilities’ outputs and hedge power generation imbalances*Investments to hedge costs incurred through supply-demand imbalances that occur when solar power outputs fail to match their original forecasts*.
As presented above, by aligning key assumptions with the IEA NZE to the extent possible and referring to our FY2022 1.5°C scenario, which includes more granular data such as demand by region and commodity, we were able to analyze the business environment surrounding natural gas/LNG and metallurgical coal, which have considerable GHG emissions and are particularly large assets, from a risk perspective. From an opportunity perspective, we analyzed the business environment surrounding renewable energy, where we believe business opportunities will increase as society continues to decarbonize
The results of our FY2022 scenario analysis above exemplify the resilience of MC’s business portfolio, even under a 1.5°C scenario assuming rapid society-wide decarbonization.
In order to manage the risks associated with climate change and appropriately seize business opportunities, we will continue to update our decarbonization scenarios and utilize them in our business environment analyses while formulating and executing business strategies to both decarbonize and reinforce our business portfolio, as announced in Midterm Corporate Strategy 2024 - Creating MC Shared Value.
MC is working to realize a decarbonized society through its businesses across the globe. Nevertheless, we are aware that our businesses are also exposed to physical risks associated with climate change. In addition to the transition risks and opportunities assessed in the aforementioned 1.5°C scenario analysis, we have also analyzed the potential impact of physical risks (e.g., flooding, drought, rising temperatures, etc.) on MC Group businesses.
Main Physical Risks:
| Increase in Unusual Weather Patterns | Risks of water shortages, floods and other resulting phenomena having an adverse impact on business operations |
|---|---|
| Climate Change | Risk of rising temperatures, etc. having an adverse impact on businesses |
With a global portfolio of companies with a diverse range of assets, it was important first to determine which MC Group assets are most exposed to the physical impacts of climate change. As such, MC has employed the following assessment process, starting with the identification of key assets.
To determine MC Group assets that are material to the operational performance of MC, MC first identified a subset of subsidiaries/ affiliates that have the greatest potential to have a material financial impact on MC using financial metrics such as profits and total asset values, and then identified assets that are material to their business.
MC engaged an independent specialist consultant to conduct a climate hazard screening exercise to identify high-risk assets that should undergo a detailed analysis. This assessment focused on 74 assets across 38 MC subsidiaries/affiliates located in 13 countries that were identified as material. During the screening process an evaluation of exposure to hazards through to 2030*The coastal flooding assessment considered exposure to sea level rise through the year 2050* was conducted, using observational data and climate model projections. The hazards included in this evaluation included coastal flooding (storm surges, sea level rise), stormwater flooding, wildfires, temperature rise, cyclones, and droughts. The evaluation employed the Intergovernmental Panel on Climate Change (IPCC)’s Representative Concentration Pathway (RCP) 8.5 scenario.
Each asset was assigned a numerical exposure score for each climate hazard. Each asset was then given a qualitative exposure rating (‘High’, ‘Medium’, or ‘Minimal’) based on the asset’s overall numerical hazard exposure score.
| Hazard Exposure Rating | Description |
|---|---|
| High | Overall hazard score greater than 30 |
| Medium | Overall hazard score 15-30 |
| Minimal | Overall hazard score less than 15 |
On the basis of the screening results, 18 of the high ranked assets located in eight countries were selected for a more detailed climate hazard analysis in this phase. The purpose of the detailed analysis was to scope the current and anticipated physical climate hazards for each asset through to 2080 (evaluated over three time frames: 2030, 2050, and 2080) - using observational data, climate model projections, and information such as previously experienced impacts due to physical climate hazards. The analysis in this phase also employed the IPCC’s Representative Concentration Pathway (RCP) 8.5 scenario, along with the RCP 4.5 scenario in order to conduct a risk analysis for a moderate range of temperature increase.
The potential severity of climate hazards for each asset were ranked by considering the probability that the climate hazard will occur, the magnitude of the hazard’s impact on the asset, and the likelihood of the asset being affected. These were then ranked on 5-level color scales (red, orange, yellow, green and grey), indicating priority areas for adaptation strategies and activities.
| Hazard Rating | Description of Hazard Severity and Level of Recommended Action |
|---|---|
| 4 | Present-day hazards causing material impacts. Adaptation strategies should be evaluated and deployed. |
| 3 | Imminent hazards likely to result in material impacts during the planning time horizons. Adaptation strategies should be developed in the near future. |
| 2 | Lower likelihood or lower impact hazards which may occur during the asset hold period but are unlikely to cause material impacts and/ or for which more information is required. Impacts should be monitored but may not need action at this time. |
| 1 | Hazards currently modeled to have minimal impact and/ or to occur after the planning time horizons; may be re-evaluated in the future. |
| 0 | Site is not exposed to this hazard. |
The results of the assessment are shared with each MC Group company to inform their future adaptation measures. The current measures and future adaptation strategies for assets that received a red hazard ranking for any of the hazard types covered by the assessment are detailed below.
Metallurgical Coal Business
| Assets subject to assessment | Mines and coal terminal owned by BHP Mitsubishi Alliance (BMA)*To address the risk of the storm surges associated with cyclones at the coal terminal, which was ranked as orange in the assessment, the latest port berth infrastructure installed has been designed to withstand a 1 in 1000 year wave event factoring in rises in sea levels and cyclone impacts due to climate change. An additional project is currently underway to upgrade an older berth to the same design standard.* |
|---|---|
| Location | Australia |
| Type of hazard | Stormwater flooding |
| Current measures |
Given that flooding due to heavy rain at mines has the potential to disrupt operations, the following measures have been implemented to improve resilience of the sites to flooding since the last flood events in 2011:
|
| Future adaptation strategies | MC together with BMA will continue to enhance physical risk mitigation in response to climate change forecasts. |
Copper business
| Assets subject to assessment | Copper mines owned by Anglo American Sur, S.A |
|---|---|
| Location | Chile |
| Type of hazard | Drought |
| Current measures | While most of the water required for the operations is reused within the mine, a certain amount is lost due to evaporation and other factors, and this water must be replenished from external sources. Since in the drought condition, there is a possibility that sufficient water intake may not be possible which could affect operations, resilience measures are considered through increased procurement of industrial wastewater and treated sewage from third parties. |
| Future adaptation strategies | In addition to the current measures, further diversification of external water procurement is under consideration. Moreover, new initiatives to further improve water reuse efficiency at the operations are also being considered. |
MC has set GHG emissions reduction targets consistent with the Paris Agreement, which aims to limit global warming to well below 2°C, preferably 1.5°C above pre-industrial levels by the end of the century, and is advancing a variety of measures to achieve these targets. With a global network of approx. 1,700 group companies, we have set GHG emissions reduction targets on a consolidated basis and work closely with MC Group companies to collect GHG emissions data and advance emissions reduction initiatives on a consolidated basis. Furthermore, we utilize our environmental management system (EMS) to collect basic information for policy planning. In FY2020, we expanded the scope of the survey via a major update to our environmental performance survey system, and are continuously working to improve the accuracy and timeliness of both qualitative and quantitative data on our GHG reduction initiatives.
MC is committed to creating MC Shared Value by simultaneously decarbonizing and reinforcing its portfolio in accordance with the net zero by 2050 and the 1.5°C target, in line with the Paris Agreement. To this end, we have set the following three goals toward the realization of a decarbonized society.
MC believes it is appropriate to set a reduction target that includes the GHG emissions of affiliated companies, which are also important as a profit base. Therefore, in calculating GHG emissions, which is the premise of this target, MC has adopted the GHG Protocol’s equity share approach that includes GHG emissions for affiliated companies.
Figure 7: GHG Emissions Reductions Targets in the Roadmap to a Carbon Neutral Society

MC is continuously tracking progress against our reduction targets. Actual performance figures of Scope 1 & 2 GHG emission towards our reduction target are as follows.

Aim to reduce existing thermal power capacity and switch to zero-emission thermal power, targeting 100% non-fossil by 2050.
Doubling MC's renewable energy power generation capacity by FY2030 (compared to the FY2020 level).
Following its new Green House Gas (GHG) emission reduction targets announced in FY2021, MC calculates GHG emissions based on the GHG Protocol’s equity share approach from FY2021, including the GHG emissions of its affiliates.
As noted in the "Roadmap to a Carbon Neutral Society", MC has considered the management and disclosure of Scope 3 emissions of particularly large emissions categories. For MC, that is Scope 3 Category 11 emissions (Use of Sold Products), and we havedisclosed this figure from FY2021.
The actual performance figures of Scope 3 Category 11 GHG emissions and its breakdown are shown in the table below. Scope 3 Category 11 emissions from White Businesses were primarily from businesses with no physical assets, thus making it relatively easier to reduce emissions (e.g., trading businesses with no fossil fuel-related assets). Emissions from Transform Businesses were mainly from those with its own assets, with high emissions due to the nature of the businesses.
Because Scope 3 emissions, including Category 11, are generated by other companies, MC will need to work with a wide range of partners throughout its supply chains to tackle this societal challenge of reducing Scope 3 emissions.
MC will tackle this issue through our Integrated EX/DX initiatives (e.g. supply of renewable energy, next-generation energy, next-generation climate technology investments through Breakthrough Energy Catalyst), and will collaborate and challenge with various stakeholders to achieve decarbonization of social and economic activities.

Our company has identified "Contributing to a Decarbonized Society" as one of its material issues, and we are promoting carbon reduction and decarbonization through our business activities in a number of fields. By leading this transformation and connecting it to our business growth, we will create MC Shared Value.
We have decided to newly disclose avoided emissions as one aspect of MC Shared Value. Specifically, this will be utilized as a quantitative indicator to measure how much our company is making concrete contributions to GHG emissions reductions as well as to what extent we are capturing business opportunities in the transition to a decarbonized society.
We will contribute to the decarbonization of society by creating avoided emissions through EX/DX-related investments of approximately 2 trillion yen during Midterm Corporate Strategy 2024.
* As of March 31, 2024
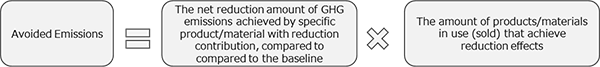
Avoided emissions are defined as the quantified contribution to the reduction or mitigation of GHG emissions by providing low-emission products and services that contribute to societal GHG emissions reduction, compared to providing existing products and services (baseline scenario).
The basic formula that we uses for calculating avoided emissions is as follows.
Flow basis(Lifetime)
Evaluation of the amount of avoided emissions by calculating the difference between the CO2 emissions of our products manufactured in the evaluation year up to the end of their life and the CO₂ emissions of the baseline scenario. This category covers avoidance in the form of materials and other products that are essential for EVs and other final products.
Stock basis (Single year)
Evaluation of the annual avoided emissions generated from our products within the year of evaluation. This category covers avoidance from renewable energy projects, etc.
The term “avoided emissions” includes not only the amount of carbon avoided by our products and services, but also the amount of carbon captured and removed.
We have chosen and assessed the following products that contribute to the transition to a decarbonized society and that generate quantifiable avoided emissions.
In principle, calculations are based on production and operating volumes, but forecasts are used for sales volumes and other data that have yet been compiled for certain products.
【Evaluation period: Stock basis (One year)】
| Assessed Product | Avoided Emissions (Unit: thousand t-CO2) |
Details | Final Product | Baseline | Calculation Formula |
|---|---|---|---|---|---|
| Solar | 474 | Contribution by the creation of renewable energy | - | Average energy mix in each country | Power generation capacity [MW] × 24 hour × 365 days × Emission factor [tCO2/MWh] × Capacity factor × Equity ratio of the company (Only the avoided emissions at the operational stage, which accounts for the majority of emissions, is calculated) |
| Onshore Wind | 1,227 | ||||
| Geothermal | 289 | ||||
| Hydroelectric | 110 | ||||
| Biomass | 339 | ||||
| Offshore Wind | 652 | ||||
| Carbon Credits (Revegetation) |
28 | Contribution by capture and storage of CO2 from new land-management practices to facilitate the regeneration of native woodlands that have been lost over the past few centuries due to clearing and overgrazing * Carbon credits generated by projects in which we have been involved, not including credits purchased by us from other companies | - | - | Carbon credits generated by regrowth of native forests × Equity ratio of the company |
【Evaluation period: Flow basis (Lifetime)】
| Assessed Product | Avoided Emissions (Unit: thousand t-CO2) |
Details | Final Product | Baseline | Calculation Formula |
|---|---|---|---|---|---|
| Aluminum | 46 | Contribution by supplying aluminum which is essential for EV chassis, etc. | Battery electric vehicle | Internal combustion engine vehicles | (Lifetime emissions of ICEVs [tCO2] - Lifetime emissions of EVs [tCO2]) × Number of EVs that incorporate our aluminum |
| 3,800 | Contribution by supplying aluminum which is essential for solar power generation frames, panels, wind power blades, towers, connectors, etc. | Solar and wind power generation facilities | Average energy mix in each country | Power generation capacity [MW] × 24 hour × 365 days × Capacity factor × Emission factor [tCO2/MWh] × Number of solar and wind power facilities that incorporate our aluminum × Economic life [years] (Only the avoided emission at the operational stage, which accounts for the majority of emissions, is calculated) | |
| Copper | 1,346 | Contribution by supplying copper which is essential for EV batteries, motors, wires, etc. | Battery electric vehicle | Internal combustion engine vehicles | (Lifetime emissions of ICEVs [tCO2] - Lifetime emissions of EVs [tCO2]) × Number of EVs that incorporate our copper |
| 52,035 | Contribution by supplying copper which is essential for solar power generation wiring, solar thermal collectors, wind power generators, wiring, etc. | Solar and wind power generation facilities | Average energy mix in each country | Power generation capacity [MW] × 24 hour × 365 days × Capacity factor × Emission factor [tCO2/MWh] × Number of solar and wind power facilities that incorporate our copper × Economic life [years] (Only the avoided emission at the operational stage, which accounts for the majority of emissions, is calculated) | |
| RO Membranes | 4,438 | Contribution by using RO membrane products to avoid the use of heat in seawater desalination | Seawater desalination using RO membranes | Desalination by evaporation method | (Lifetime emissions of Seawater desalination using RO membranes [tCO2] - Lifetime emissions of Desalination by evaporation method [tCO2]) × Sales quantity (unit) × Equity ratio of the company |
| Trunk line DX | 7 | Contribution by providing a timetable visualization and optimization system for trucking companies to reduce the number of truck operations | - | Situation before project implementation | CO2 emissions per truck (average annual mileage [km]) ÷ Fuel consumption [km/ℓ] × Emission Factor [tCO2/ℓ]) × Reduced number of units [unit] × the assumption of Economic life [years] |
| Needle coke | 6,355 | Contribution by supplying needle coke, which is essential for graphite electrodes in electric furnaces that produce steel with low greenhouse gas emissions | Electric furnace steel (Graphite electrodes for electric furnaces) | Blast furnace steel | (Lifetime emissions of blast furnace steel [tCO2] - Lifetime emissions of electric furnace steel [tCO2]) × Number of Graphite electrode for electric furnace steel that incorporate our Needle coke × Coefficient of steel production that can be produced from 1 ton of graphite electrode |
| 13 | Contribution by supplying needle coke used for the anode material of EV lithium-ion batteries | Battery Electric Vehicle (anode material for lithium-ion batteries) | Internal combustion engine vehicle | (Lifetime emissions of ICEVs [tCO2] - Lifetime emissions of EVs [tCO2]) × Number of anode material for lithium batteries in EVs that incorporate our Needle coke from MC |
We have calculated the estimated values for FY2024 and beyond for the avoided emissions of projects that have not yet begun operations or provision of services, or are soon to begin operations. In the future, we will calculate the actual amounts of avoided emissions based on the operational performance of each project.
Through operation of solar, onshore wind, hydro, and offshore wind power generation facilities on which we have already begun construction, we expect that the amount of avoided emissions will increase by approximately 640,000 tons/year on a stock basis.
By providing recycled PET resin with chemical recycling technology in our manufacturing and sales operations for beverage bottles, compared to PET resin derived from fossil fuels in the future, we expect the amount of avoided emissions to be approximately 18,000 tons/year on a flow basis.
By prolonging the period during which rice-paddy fields are drained of water and dried during the paddy rice cultivation period, we are planning and coordinating a project to avoid greenhouse gas (methane) emissions from the soil, which will equate to approximately 1,000 tons per year on a stock basis in FY2023. In FY2024 and beyond, MC is aiming to increase the amount of these avoided emissions in line with an expansion of the project scale.
We expect to reduce fuel consumption and decrease GHG emissions in the shipping industry by installing next-generation “rigid sails” (Wing-shaped sail) on our owned cargo ship, which is estimated to contribute approximately 3,000 tons/year on a stock basis.
* The estimated avoided emissions shown above are subject to change depending on the actual operation and sales status of the commercial products
| Country | Power Plant | Fuel | Net Equity Basis (Net, 10,000 kW) |
|---|---|---|---|
| Japan | MCKB Energy Services | Gas, Biogas | 3.2 |
| Japan | MC Kawajiri Energy Services | Gas | 3.8 |
| Japan | MC Shiohama Energy Services | Gas, Coal | 9.8 |
| Japan | MCJ Energy Services | Gas | 2.2 |
| Japan | Gonoike Bioenergy Services | Biomass exclusive combustion | 1.1 |
| Japan | MCM Energy Services | Coal, Biomass mixed combustion | 5.2 |
| Japan | MC Hokuetsu Energy Services | Gas | 2.0 |
| Japan | Mizushima Energy Center | Coal | 5.6 |
| Country | Power Plant | Net Equity Basis (Net, 10,000 kW) |
|---|---|---|
| USA | Frontier | 23.2 |
| USA | Wildflower/Indigo | 13.6 |
| USA | Wildflower/Larkspur | 9.4 |
| USA | Mariposa | 20.0 |
| USA | Sentinel | 42.4 |
| USA | CPV Valley | 36.0 |
| USA | Westmoreland | 35.3 |
| Mexico | Tuxpan II | 24.8 |
| Mexico | Tuxpan V | 24.8 |
| The Netherlands | Gas generation owned by ENECO | 75.4 |
| Jordan | IPP-3 | 20.1 |
| Qatar | Facility D | 50.4 |
| Thailand | Gas generation owned by EGCO | 22.2 |
| Japan | Naoetsu Energy Center | 10.7 |
| Country | Power Plant | Fuel | Net Equity Basis (Net, 10,000 kW) |
|---|---|---|---|
| Thailand | Coal-fired power projects owned by EGCO | Coal | 8.3 |
| Taiwan | Ho-Ping | Coal | 26.4 |
| Japan | Nippon Paper Ishinomaki Energy Center | Coal Biomass Co-generation |
4.4 |
Transparency in climate action is key. To effectively engage with our stakeholders and inform them of our climate initiatives and progress, MC publishes its value creation process along with both financial and non-financial performance indicators in our Integrated Report.
MC actively disseminates information about its ESG-related initiatives to its various stakeholders around the world. CDP is a UK-based international enironemental NGO, and conducts activities to promote corporate environmental information disclosure at the request of institutional investors around the world. It holds the world’s largest database of corporate disclosures on climate change initiatives, and since FY2003, MC has responded the CDP Climate Change, which evaluates the climate change management of companies.
CDP Climate Change 2023 Response (PDF:783KB)MC supports TCFD Recommendations and actively discloses climate-related financial information through various channels, including CDP and its Sustainability report, and continues to improve such disclosure.
MC is proud that our President and CEO is a founding member of the TCFD Consortium of Japan, a platform established for financial institutions and corporations to pursue climate-related financial disclosures recommended by the TCFD. Additionally, the General Manager of MC’s Sustainability Department served as a TCFD member from 2018 to 2021, and a plannning committee member of the TCFD consortium thereafter MC has been actively working to expand awareness of the TCFD and promote activities related to TCFD.
For an overview of how MC is meeting recommendation, please see TCFD overview.